From ERP to report.
In a single flow.
Automated collection, auditable calculation and reports ready for CSRD, GRI and SASB. No parallel spreadsheet and no rework.
Companies that trust Mangue Tech









From entry to report. In six screens.
From the invoice to an auditable report, with no parallel spreadsheet. It advances on its own every 6 seconds; click to explore.
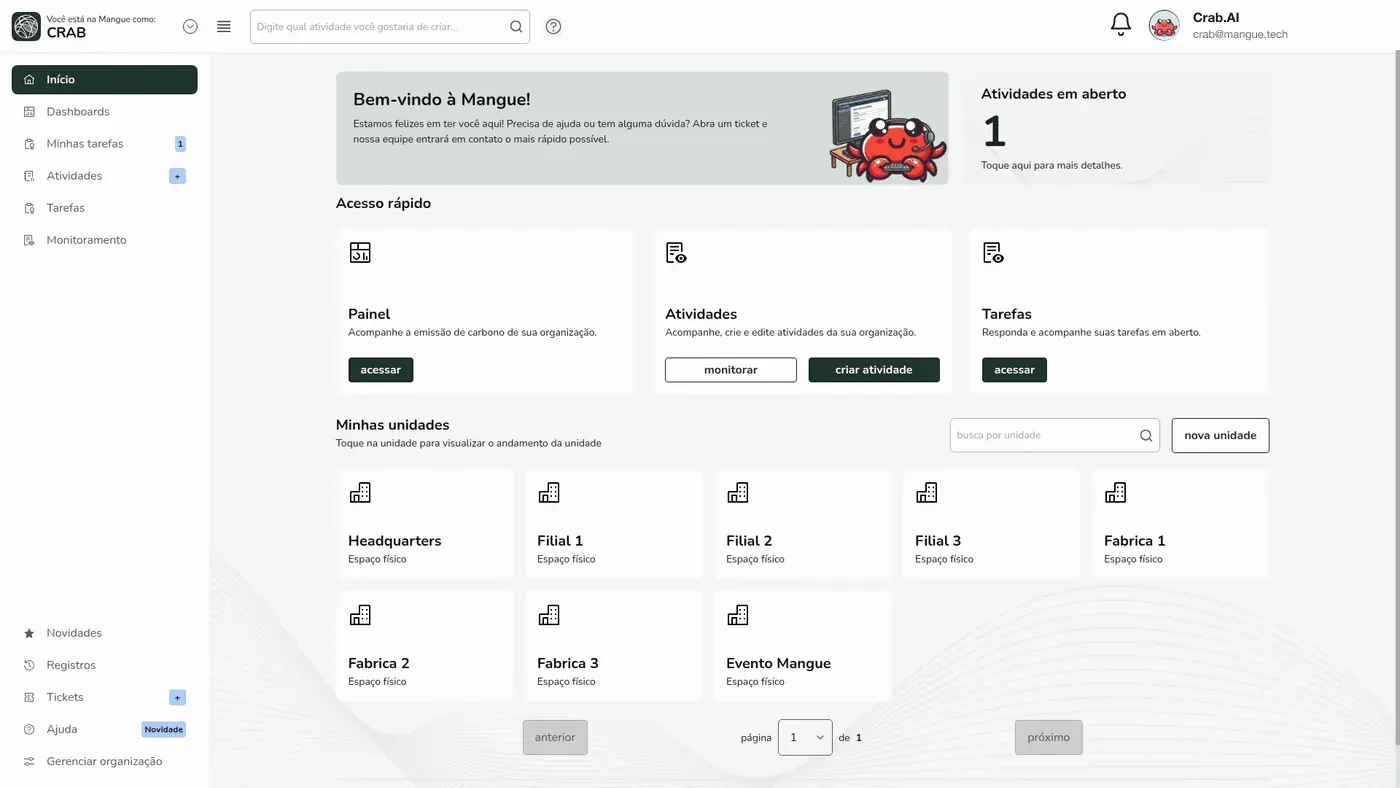
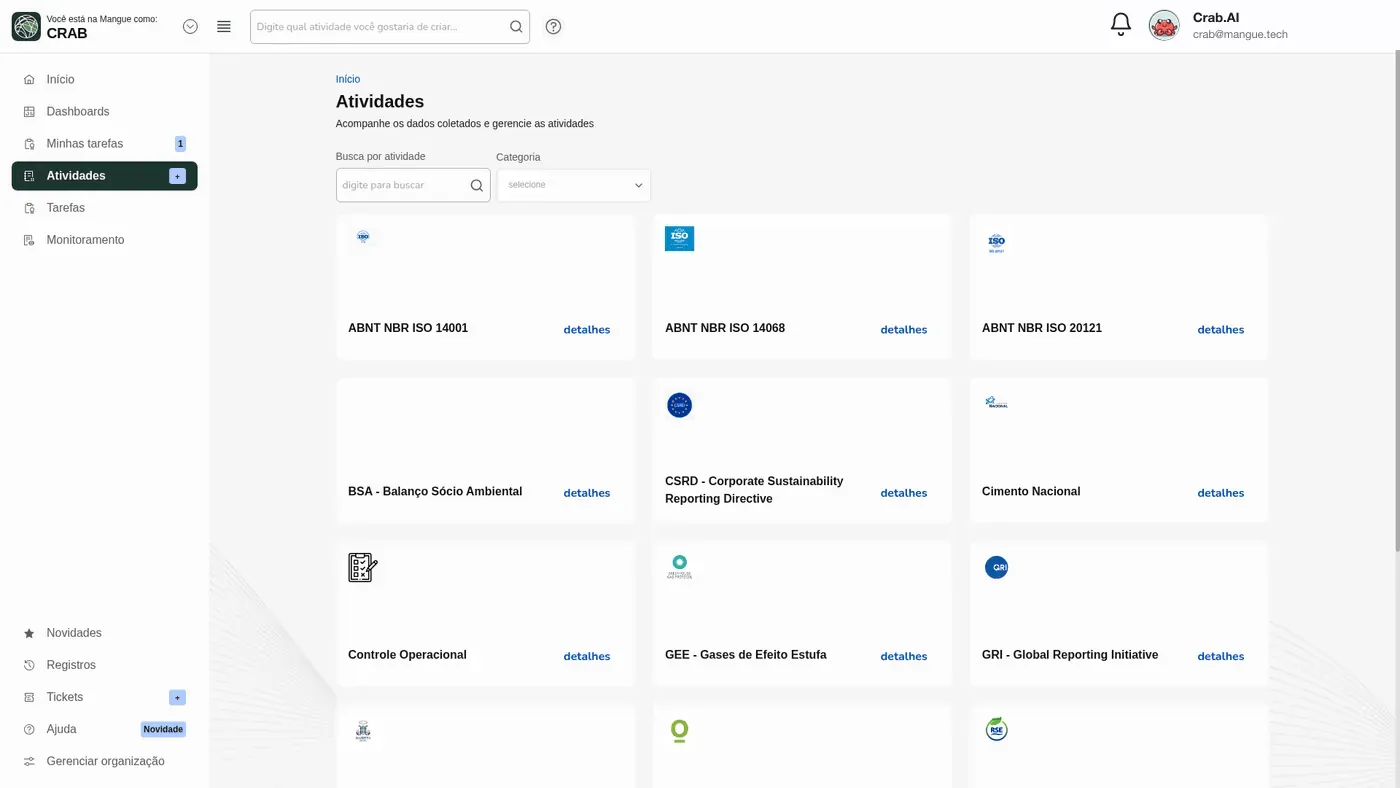
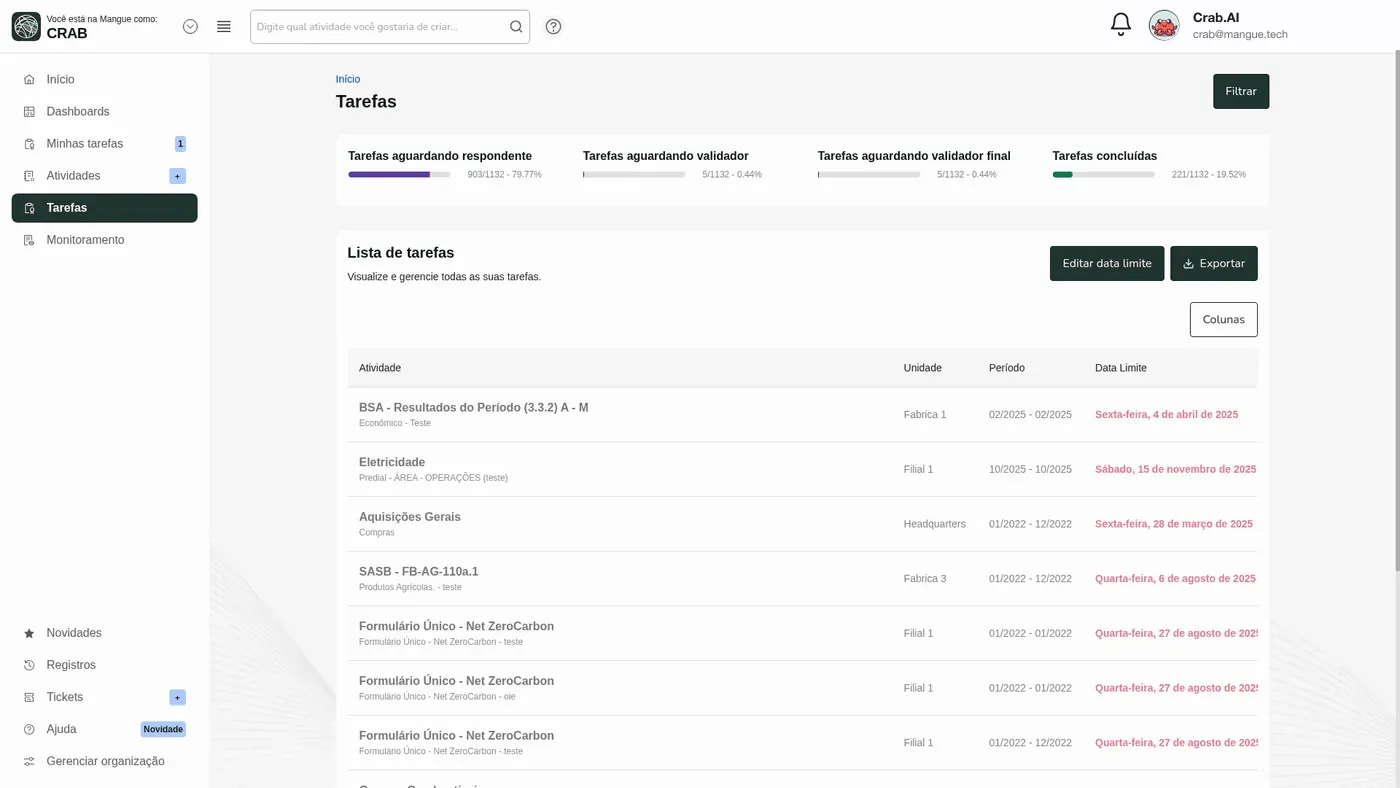
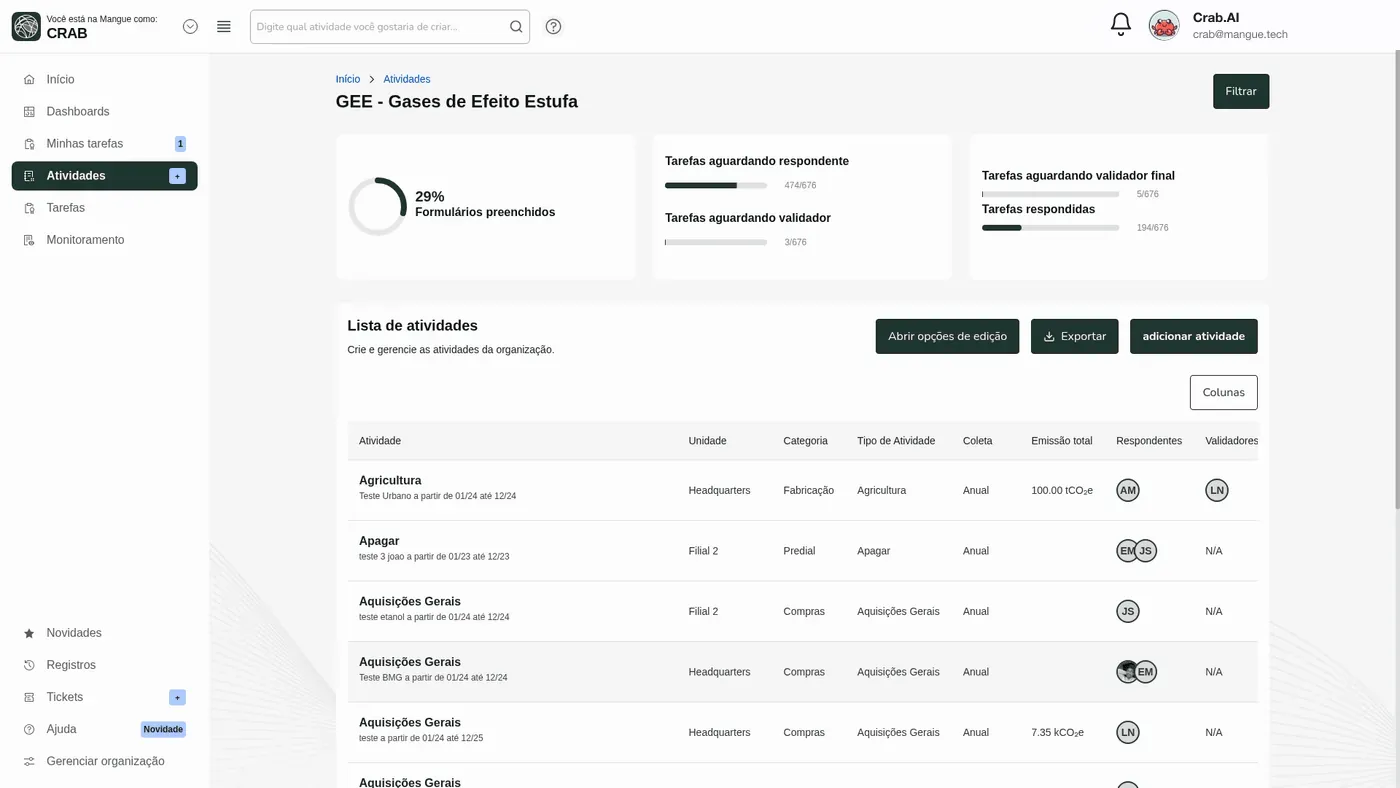
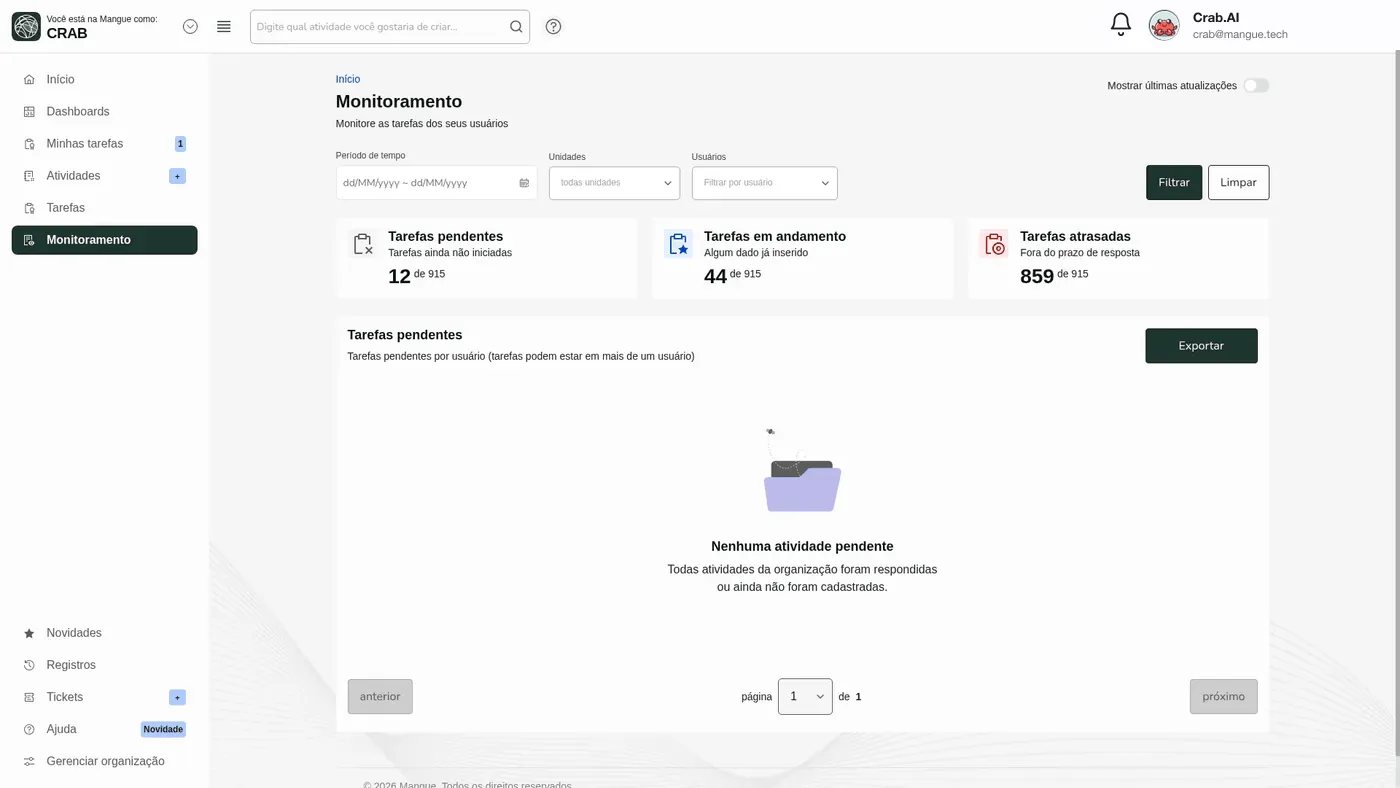
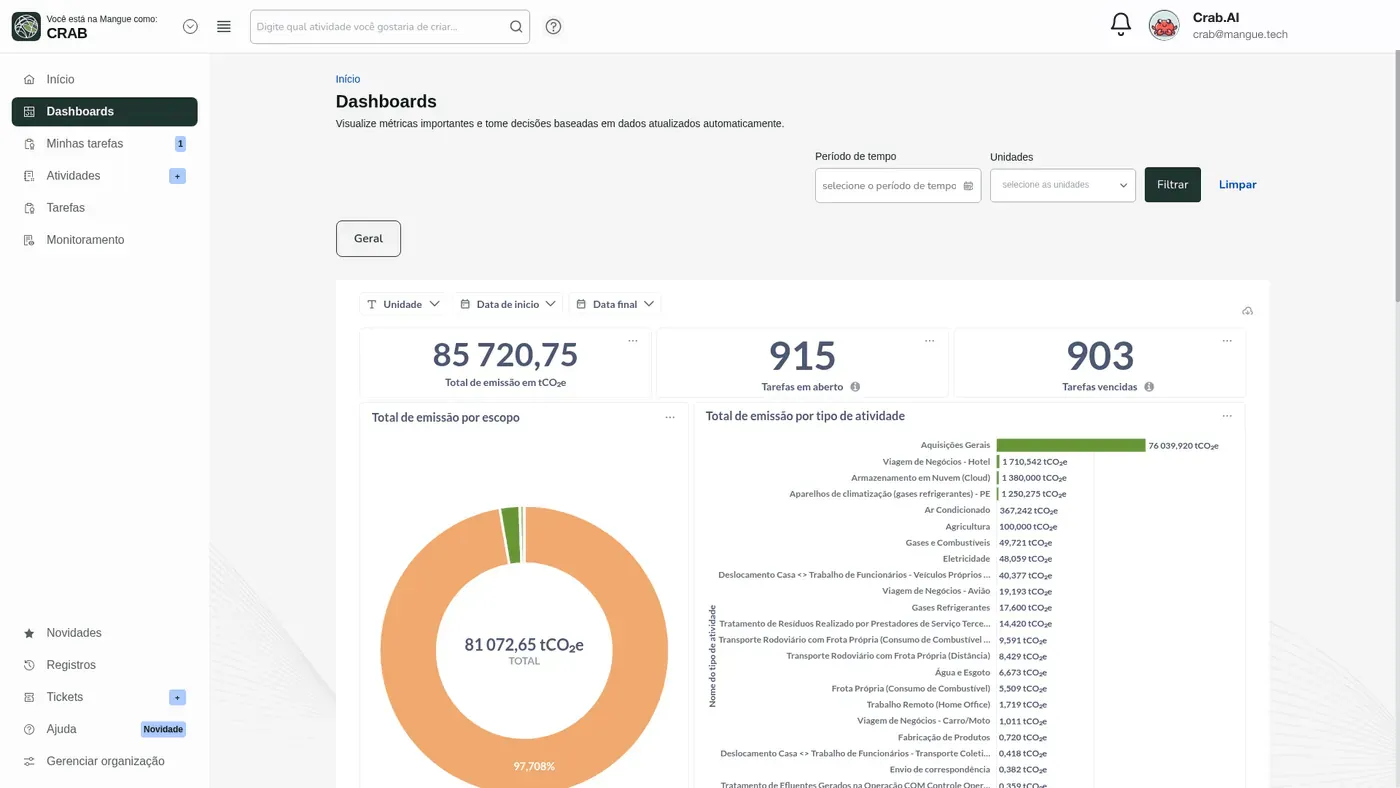
Your ESG operation without the chaos.
Tasks, updates and shortcuts in one place. The team logs in and knows what is missing. Without asking anyone.
Your ESG operation without the chaos.
Tasks, updates and shortcuts in one place. The team logs in and knows what is missing. Without asking anyone.
The defensible number, right away.
Total tCO₂e by scope, site and category, updated in real time. No waiting for a manual month-end close.
Every line with a source and an owner.
Activity, site, period, factor, owner and validator. The auditor asks for one number, you open the whole line. With evidence.
Collection without chasing people.
A workflow with three non-overlapping roles, an SLA per task, a pending-items dashboard. Chasing by email becomes a flow.
Where Crab.AI suggests before you get it wrong.
Detail by activity with traceable factors and inline AI suggestions. Classification, factor and anomaly detection right on the line.
The auditor looks alongside you, in real time.
Progress by site, framework and period. Read-only access for the external verifier. No more PDF-and-email marathon.
Platform vs. spreadsheet.
Four concrete changes in how you close the inventory.
How to choose ESG and carbon management software
ESG software lets a company collect and manage corporate sustainability data in one place, calculate its GHG Inventory and turn the result into reports such as GRI, IFRS S2 and CSRD. In practice, the wrong choice shows up in the first cycle: data that never leaves the ERP, emission factors with no source and a report that has to be rebuilt for every framework.
Carbon management software is the climate slice of ESG software: it runs the GHG Inventory (the greenhouse gas inventory across Scopes 1, 2 and 3), tracks targets and measures decarbonization. At most companies the project starts there, and the heaviest work is Scope 3, which has 15 categories and depends on supplier data.
Before signing with any vendor, Mangue Tech included, use these six criteria. They apply to both kinds of software:
| Criterion | What to ask the vendor | Why it matters |
|---|---|---|
| ERP integration | Does it connect to SAP, TOTVS, Senior, Oracle or whatever system the company already runs? Does it import spreadsheets and APIs? | Collecting and managing data by hand is where projects slip and where errors start. |
| Factor traceability | Does every emission factor carry a source, version and date (MCTI, IPCC, DEFRA)? Can you trace the final figure back to the invoice? | It is the first thing an independent verifier asks for. Without a trail, the inventory comes back. |
| Scope 1, 2 and 3 coverage | Does it calculate all 15 Scope 3 categories or just energy and fleet? | Scope 3 is usually most of the emissions, and it is what customers and investors ask about. |
| Multi-framework | Does the same data produce GRI, IFRS S2, CSRD, SASB and CDP without rework? | Each new report should not turn into a new data-collection project. |
| AI for the tedious work | Does the AI classify spend, suggest factors and flag anomalies? Does the final call stay with your team? | An AI-based platform saves time on classification, but every suggestion has to stay auditable. |
| Support and methodology | Are there GHG Protocol specialists to review the inventory, or just technical support for the system? | Software without a method is just a more expensive spreadsheet. |
Start with the inventory, grow into multi-framework
Not every company needs everything in year one. An ESG strategy that works starts with emissions data and grows as customers, investors and regulators ask for more:
- GHG Inventory for Scopes 1 and 2, plus the most relevant Scope 3 categories. It is the baseline required by Brazil's SBCE, by CDP and by any customer asking for emissions data. See the greenhouse gas inventory.
- Full Scope 3 and reduction targets. With the history in the platform, the 15 categories, SBTi targets and the decarbonization plan come in.
- Multi-framework reporting. The same data feeds GRI, IFRS S2, CSRD and CDP, with a trail ready for independent verification.
The Mangue Tech platform follows that path without switching systems: the year-one inventory is the same base as the year-three reports. If you are still deciding between a tool and a spreadsheet, read platform vs spreadsheet for carbon management and how to choose a carbon management platform.
Everything your ESG team needs. In one place.
01 · Coleta
Connectors ready to go.
Native integrations with SAP, TOTVS, Senior, Excel and REST API. Interactive cards for manual entry or bulk upload via a standard spreadsheet. Automatic reconciliation against Brazilian factors.
02 · Calculation
Versioned engine.
The full GHG Protocol. Scopes 1, 2 and 3, biogenic emissions, location-based and market-based approaches. Base-year recalculation with the history in the open. Every factor with its source, year and gas.
03 · Report
Ready for the auditor.
CSRD/ESRS, GRI, SASB, IFRS S1/S2, CDP, ISE B3, CBAM, BSA, ISO 14064, UN Global Compact. Generated from the same base. Calculation records and the evidence folder included.
04 · Auditoria
Locked record.
Three roles with no overlap: collector, validator, approver. Multi-level approval workflows. Every figure traces back to the activity data, the source evidence and the person responsible.
Modular architecture. Turn on what you need.
Each module works on its own. Together they make up the full ESG operation.
Organizational structure
Registry of companies, sites, plants, corporate hierarchy, emitting assets and suppliers. Multi-company and multi-site.
ESG indicator management
Environmental, social and governance indicators with formulas, targets, frequency and an owner set per indicator.
GHG inventory
Scopes 1, 2 and 3. Biogenic emissions. Location-based and market-based. Annual consolidation by company, site or category.
Emission factors
60k+ factors from MCTI, DEFRA, EPA, IEA, Ecoinvent and IPCC AR6. Every factor with its source, year, gas, region and unit.
Data collection
Interactive cards or bulk spreadsheet upload. Validation of format, ranges and required fields. Status by user and by area.
Evidence folder
Attach documents, invoices and contracts as auditable evidence. Versioning and per-document access control.
Workflows
Multi-level validation: collector → validator → approver. Three roles with no overlap. Collection and approval SLAs. A pending-items dashboard.
Reporting and disclosure
Outputs for GHG Protocol, GRI, SASB, CSRD/ESRS, IFRS S1/S2, CDP, ISE B3, CBAM, BSA, ISO and the UN Global Compact.
Administration and permissions
User and profile management. Permissions by module, company, site or indicator. Roles: admin, collector, validator, approver, auditor.
Faster, more consistent, more visible.
Three sides of the same gain. Reported by the people who run it every day.
"Things are faster now. To me, efficient means time. Today we have a system, a platform. Not just a spreadsheet to fill in."


"I had seen other platforms, but I needed something with a simple interface for the end user. When Mangue came along with the intent to simplify, with other ways of getting to the data, it helped a lot."

"The platform's main job is to make our life easier, giving visibility to something that was not visible to everyone before."


Connectors ready to go · ERP, spreadsheet, BI, API
Technical coverage
One database. Any output.
Emission factors
DEFRA, EPA, IEA, Ecoinvent, IPCC, MCTI. Every factor with its source, year, gas and region. No calculations pulled from a drawer.
Frameworks
GHG Protocol, CSRD, IFRS S2, CDP, GRI, SASB, CBAM, SBCE, TCFD, ISO 14064.
Manual time
Less effort on the annual inventory. From the invoice to the final delivery, in the same place.
How this works
One entry, once. It becomes any report you need.
Activity data
Electricity · São Paulo site · 82.412 kWh
Classification
Energy
Scope
Scope 2
Factor and source
0,0840 kgCO₂e/kWh · MCTI 2023
Calculation
82.412 × 0,0840
Result
6,92 tCO₂e
Responsible
Approver
Evidence
Invoice attached
Same line, any framework.
From calculation to offsetting, on the same platform.
The platform links straight to Carbonext's forest portfolio (REDD+, ARR and ALM), our investor. REDD+ credits originated by Carbonext, traceable to the project.
Questions we hear every week
How long does implementation take?+
It depends on the scope and how mature the company's data is. Technical onboarding is quick; collection and calculation follow your operation's pace. The specific schedule is set in the initial diagnosis.
Does it integrate with my ERP?+
Connectors for SAP, TOTVS, Senior, Oracle, Protheus, Excel and REST API. If the system exports data, the platform imports it.
Is my data safe?+
Cloud hosting with daily backups, encryption in transit and at rest, and LGPD compliance.
Can I try it first?+
Yes. We book a demo with a specialist so you can see the platform in your sector's context. No card, no commitment.
Consulting or platform?+
We deliver both. The platform stays with you afterwards. Real autonomy.
Carbon Aware Badge
Closed your GHG inventory?
Display the Aware Badge.
With a Scope 1, 2 and 3 GHG inventory verified by an independent third party, your company can display the Carbon Aware Badge. Recognition for those who measure and report with auditable rigor.
